
Bad forecasting costs you money at 2pm on Tuesday when you're scrambling to call in servers while the kitchen runs out of prep
Restaurant forecasting feels like trying to predict weather three weeks out. You track sales, know when lunch rushes happen, yet somehow you're still caught with too much staff on dead nights and not enough when that tour bus appears.
Every restaurant forecasts something. Some managers use last year's numbers, others rely on twenty years of gut instincts. A few create elaborate spreadsheets that get abandoned by week three.
These systems break because restaurant operations move faster than manual tracking can handle. Your Tuesday server calls out, shifts get swapped, labor projections never get updated. A new office opens nearby, traffic patterns shift, but ordering stays locked to last month's averages. Small misses become real money—wasted food, overtime labor, lost sales from stockouts.
Over the past eighteen months, I've watched restaurants implement AI-powered forecasting systems. Not enterprise-level chain software, but practical tools for independents doing $2-4 million annually. The successful ones didn't flip a switch—they followed deliberate rollouts that protected operations while proving value.
Phase One: Getting Your House in Order (Weeks 1-4)
Clean data comes before any forecasting software. Most restaurants discover their POS data is messier than expected.
Start with a data audit. Pull three months of sales and check basic consistency. Are menu items named consistently? One restaurant had "Caesar Salad" entered fourteen different ways—with chicken, without, different spellings, abbreviations. Their forecasting showed dozens of Caesar variations when it was really one salad with options.
Sales Data Requirements:
-
Hourly sales by category
-
Item-level sales with consistent naming
-
Clear day-of-week patterns
-
Special events flagged (holidays, local events, weather)
Labor Data Cleanup:
-
Actual hours worked, not scheduled
-
Role classifications matching real operations
-
Overtime hours separated
-
No-shows and late arrivals tracked
Inventory Basics:
-
Starting counts for top 20% of ingredients by cost
-
Waste tracking for proteins and produce minimum
-
Delivery schedules documented
-
Current par levels, even rough estimates
Don't wait for perfect data. You need roughly 80% accuracy to start seeing patterns. One steakhouse delayed their pilot six months perfecting wine inventory when their real money was in protein waste and labor scheduling.
If your POS exports are unreliable, a 30-day manual tracking spreadsheet gives a usable baseline quickly.
Create a simple tracking spreadsheet for the next month if current systems don't capture this data. Manual work upfront, but entering daily numbers for 30 days creates baseline data worth more than two years of inconsistent POS exports.
Phase Two: The Smart Pilot Approach (Weeks 5-12)
Pick one area first. Not everything at once. Start with produce ordering or front-of-house scheduling—they forgive mistakes better than protein ordering or kitchen staffing.
Eliminate operational bottlenecks effortlessly.
Dineoly helps you manage every reservation, order, and staff shift seamlessly.
- Unified reservation and order management
- Real-time staff scheduling
- Inventory and sales tracking
No credit card required
Week 5-6: Baseline Tracking
Document current ordering accuracy. How much gets thrown away? How often do you run out and 86 menu items? Don't judge the numbers yet. One breakfast place discovered $400 weekly berry waste because they ordered for busy weekend traffic but forgot dead Mondays.
Week 7-8: Parallel Running
Run AI forecasting alongside your current method. Don't change actual orders. Compare what the system suggests versus normal ordering. Document differences.
This parallel period reveals hidden patterns. A taco shop noticed AI consistently suggested 30% more cilantro for Thursdays. Turns out their Thursday special used triple normal amounts, but nobody connected that to produce ordering.
Week 9-10: Limited Implementation
-
Waste reduction (weight and dollar value)
-
Stockout incidents
-
Time saved on ordering
-
Staff feedback on prep levels
Week 11-12: Adjustment and Expansion
Based on results, expand to more items or adjust model parameters. Most restaurants find AI over-orders initially because it hasn't learned specific waste patterns. After two weeks of feedback, accuracy typically jumps from 70% to 85%.
The Staffing Pilot: Different Game, Same Playbook
Staffing pilots follow similar phases but need more change management. Your team will be skeptical—they've seen scheduling software create more problems than it solved.
Baseline Metrics to Track:
-
Labor cost as percentage of sales (by daypart)
-
Customer wait times during rush periods
-
Tables turned per server per shift
-
Kitchen ticket times
-
Manager hours spent scheduling
Start with front-of-house only. Servers adapt to schedule changes easier than cooks, and FOH labor is more flexible.
For a 60-seat casual dining restaurant:
Week 1-2: Track current scheduling accuracy. How often do you call people in or send them home early? Most restaurants discover they're overstaffed 40% of shifts and understaffed 20%.
Week 3-4: Run AI suggestions parallel to current schedule. Don't change anything, just compare. AI might suggest 4 servers for Tuesday lunch while you normally schedule 5. Note these differences.
Week 5-6: Implement AI scheduling for weekday lunches only. Lower-stakes period lets you test without risking busy weekend service.
Week 7-8: Expand to all lunch shifts, keep dinner manual. Document server feedback carefully—they notice patterns you miss.
Servers often prefer AI scheduling once they understand it. The system learns availability patterns and creates more consistent schedules than managers juggling requests mentally.
Reorder Triggers That Actually Work
Traditional reorder points fail because restaurant demand varies dramatically. Monday prep needs look nothing like Friday's. Static par levels mean constant over-ordering or under-preparation.
AI forecasting enables dynamic reorder triggers adjusting for:
-
Next 3 days' predicted sales
-
Day of week patterns
-
Weather forecast
-
Local events calendar
-
Historical waste patterns
Instead of "order tomatoes when below 3 cases," the trigger becomes "order when projected 3-day usage exceeds current inventory minus safety stock." That safety stock also adjusts—higher before weekends, lower on slow days.
Setting these up requires mapping real lead times:
| Supplier Type | Typical Lead Time | Safety Stock Multiplier |
|---|---|---|
| Produce | 1 day | 1.5x daily usage |
| Dairy | 2 days | 2x daily usage |
| Proteins | 2-3 days | 2.5x daily usage |
| Dry goods | 3-5 days | 4x daily usage |
| Alcohol | 5-7 days | 7x daily usage |
The multipliers seem high but AI forecasting reduces baseline usage prediction error from around 30% to 10-15%. You're protecting against remaining uncertainty.
Change Management: Getting Your Team on Board
The hardest part isn't technology—it's getting a busy kitchen team to trust a computer over intuition.
Start with transparency. Show your team current waste numbers and labor costs. Not to shame, but establish baseline. One pizzeria posted weekly food waste photos in the break room—$600 of spoiled vegetables made the problem tangible.
Include key people early:
-
Week 1-2 Brief kitchen manager and lead servers on the pilot. Ask for input on what breaks most often in current systems. They know pain points better than anyone.
-
Week 3-4 Show sample forecasts versus actual sales from last month. Let them poke holes. They will, and that's good. Skepticism leads to better implementation.
-
Week 5-6 Have them shadow parallel running. When they see AI predict that weird Tuesday lunch rush happening every third week, they start buying in.
-
Week 7-8 Give them veto power during early implementation. If AI says 3 servers but your floor manager wants 4, go with 4. Track both decisions. When AI is right, they notice. When it's wrong, you learn and adjust.
Create feedback loops that matter:
-
Daily huddles reviewing yesterday's forecast accuracy
-
Weekly waste reviews with photos
-
Monthly labor cost analysis by shift
-
Quarterly bonuses tied to waste reduction and labor targets
Bonus structure matters more than you'd think. One restaurant shifted 20% of manager bonuses to forecast accuracy metrics—food cost and labor percentage. Suddenly everyone paid attention to predictions.
Common Implementation Disasters and How to Avoid Them
Disaster #1: Going Too Big Too Fast
A gastropub tried implementing AI forecasting for everything simultaneously—food, alcohol, labor, supply ordering. Week two, they ran out of toilet paper because nobody checked if AI's "optimal" order met vendor minimums. Week three, they over-ordered craft beer based on one anomalous event. By week four, they abandoned the whole system.
Fix: One category at a time. Master produce before proteins. Nail lunch scheduling before dinner service.
Disaster #2: Ignoring Seasonal Patterns
AI needs historical data for pattern recognition. A seafood restaurant launched their pilot in January using just three months of winter data. Come Memorial Day, the system had no clue their patio tripled capacity and raw bar sales exploded. They understaffed, under-ordered, and lost crushing revenue the first warm weekend.
Fix: Include at least one full year of data when possible. If not, manually flag seasonal shifts and override AI during transition periods.
Disaster #3: Not Training the System on Your Reality
Every restaurant has quirks. Maybe Sunday brunch pulls from three churches letting out. Perhaps bar sales crater during football season because everyone goes to the sports bar next door. Generic AI models don't know these patterns.
A breakfast joint near a hospital learned this the hard way. AI couldn't figure out why random weekdays spiked 40% until someone mentioned nurse shift changes every third Wednesday. Once tagged, the pattern became predictable.
Fix: Spend two weeks documenting every local influence on traffic. Train stations, offices, schools, entertainment venues, weather. Feed these to your system as external factors.
Disaster #4: Treating AI Suggestions as Gospel
AI suggested a burger place order 50 pounds of ground beef for Super Bowl Sunday based on previous year's sales. Nobody questioned it until they remembered last year the local team was playing. This year they weren't even in playoffs. They would have wasted 30 pounds following the suggestion blindly.
Fix: Always sanity-check AI recommendations against common sense. The system is a tool, not a replacement for thinking.
Sample Timeline for Full Implementation
Based on dozens of rollouts, here's realistic timing for a restaurant doing $3 million annually:
Month 1: Data Cleanup
-
Week 1-2
Audit existing data quality
-
Week 3-4
Fix critical data issues, establish tracking
Month 2: Produce Pilot
-
Week 1-2
Baseline tracking
-
Week 3-4
Parallel running and testing
Month 3: Expand Produce, Start Staffing Pilot
-
Week 1-2
Full produce implementation
-
Week 3-4
FOH staffing parallel testing
Month 4: Refine and Expand
-
Week 1-2
Add protein forecasting
-
Week 3-4
Expand staffing to BOH
Month 5: Integration
-
Week 1-2
Connect forecasting to ordering systems
-
Week 3-4
Automate reorder triggers
Month 6: Optimization
-
Week 1-2
Fine-tune all parameters
-
Week 3-4
Train team on maintenance
This seems slow, but restaurants that rush typically abandon systems within three months. Those following measured rollouts see sustained improvements.
Below is a visual of the rollout workflow.
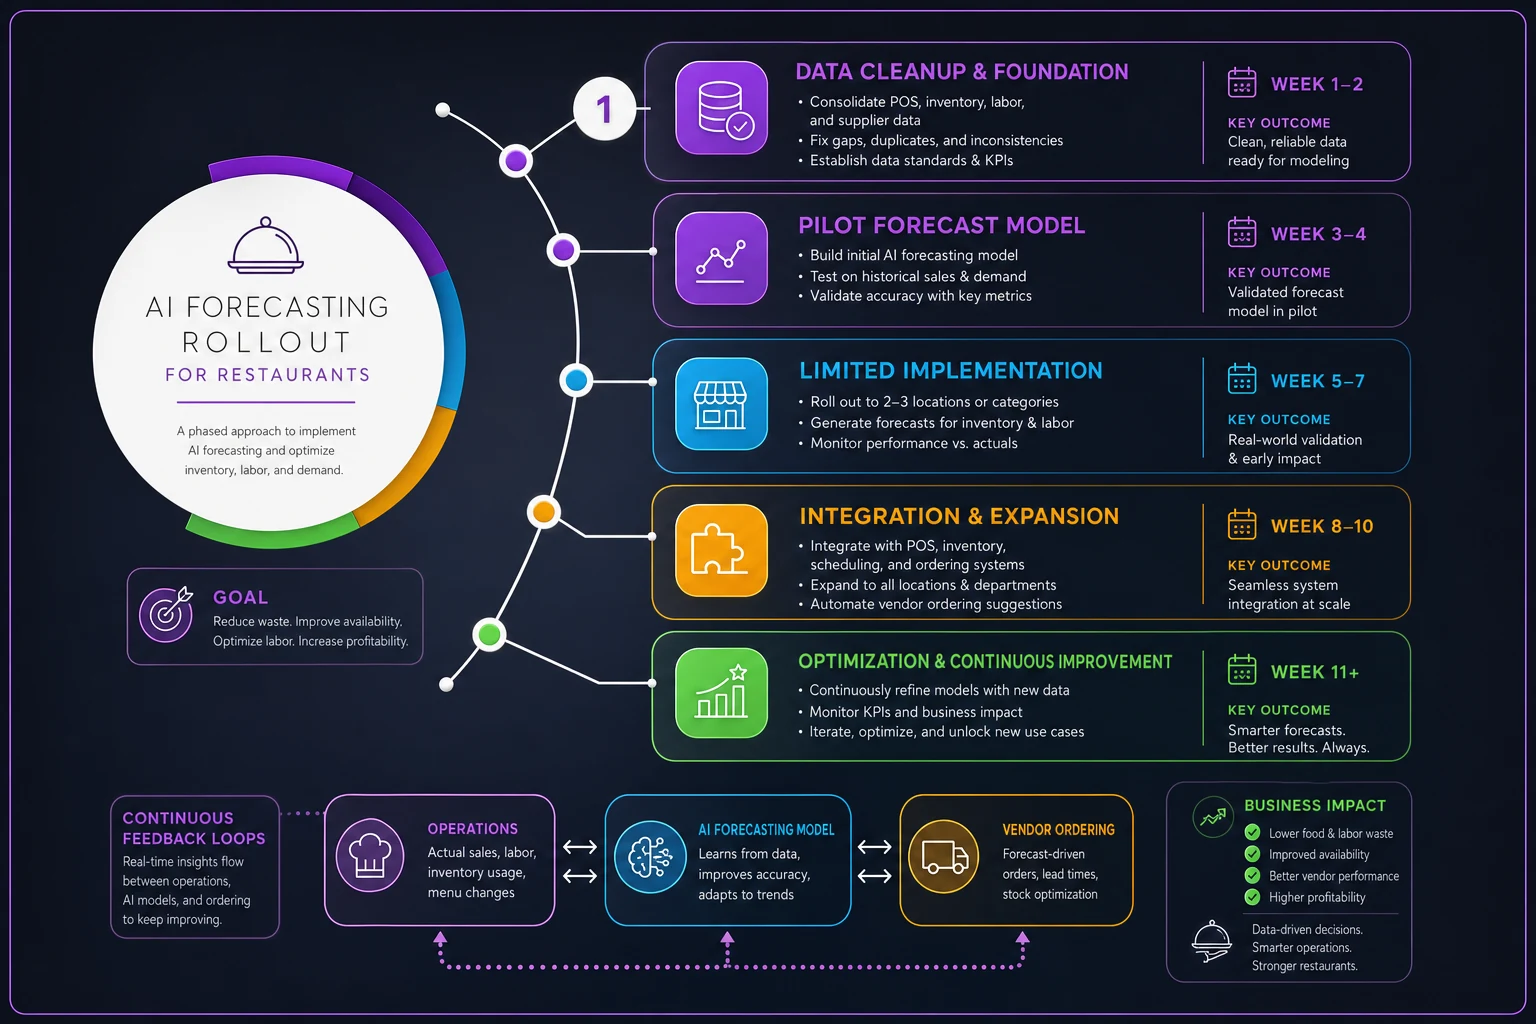
The diagram shows phases, key weeks, and where to collect feedback for iterative improvements.
Metrics That Matter: Tracking Your Success
Vanity metrics won't pay bills. Track numbers connecting to real money:
Primary Metrics:
-
Food cost percentage (should drop 2-4% within 6 months)
-
Labor cost percentage (typically improves 1-3%)
-
Number of 86'd items per week (should drop 50%+)
-
End-of-night waste value (target 40% reduction)
Secondary Metrics:
-
Manager hours spent scheduling (usually cuts in half)
-
Order processing time (drops from hours to minutes)
-
Inventory turns (should increase 15-20%)
-
Customer complaints about availability
Leading Indicators:
-
Forecast accuracy percentage (target 85%+ after 3 months)
-
Staff schedule satisfaction scores
-
Prep completion rates
-
Vendor order accuracy
One metric nobody talks about: reduced manager stress. When your chef isn't constantly firefighting shortage issues and your GM isn't rebuilding schedules daily, they can focus on hospitality and quality. Hard to quantify, impossible to ignore.
The Hidden Dataset: What to Track That Others Miss
Beyond obvious sales and labor data, successful implementations track unconventional metrics:
Environmental Factors:
-
Actual weather versus forecast (rain doesn't always hurt sales)
-
Construction or road work nearby
-
Competitor promotions or closures
-
Local event attendance (not just existence)
Internal Patterns:
-
Server performance variations by shift
-
Kitchen capacity by station by daypart
-
Prep time requirements by cook skill level
-
Table turn times by server combination
Customer Behaviors:
-
Modification patterns (affects prep requirements)
-
Split plate frequency (impacts portion planning)
-
Drink attachment rates by server
-
Dessert sales by day of week
A barbecue restaurant discovered brisket sales correlated with humidity levels—dry days meant more brisket, humid days shifted to pulled pork. Once tracked, AI nailed this pattern and reduced protein waste by 30%.
Making the Business Case (With Real Numbers)
Take a typical casual dining restaurant doing $3 million annually:
Current State:
-
Food cost
32% ($960,000)
-
Labor cost
30% ($900,000)
-
Weekly waste
$1,200
-
Manager scheduling time
6 hours/week
Post-Implementation (Month 6):
-
Food cost
29% ($870,000) - $90,000 saved
-
Labor cost
28% ($840,000) - $60,000 saved
-
Weekly waste
$720 - $25,000 annual savings
-
Manager scheduling time
2 hours/week - 200 hours saved annually
Total annual impact: $175,000 in direct savings plus 200 manager hours redeployed to revenue-generating activities.
The investment? Most AI forecasting platforms run $300-800 monthly for restaurants this size. Even at the high end, that's $9,600 annually for an 18x return.
Integration Points: Where AI Forecasting Connects
Real power comes from integration. Your AI forecasting should connect to:
-
POS system (automatic sales data flow)
-
Scheduling software (direct schedule generation)
-
Inventory management (automatic order generation)
-
Accounting system (cost tracking and reporting)
Each integration multiplies value. When forecasting talks to scheduling, you're not just predicting demand—you're automatically creating right staffing to meet it. When it connects to inventory, purchase orders generate themselves based on predicted needs.
Start simple though. Most restaurants get 80% of value from POS integration alone. Add connections gradually as your team gets comfortable with the core system.
Beyond the Pilot: Maintaining Momentum
The pilot ends, results look good, then what? This is where many restaurants stumble. Energy dissipates, old habits creep back, and six months later you're manually scheduling again.
Successful restaurants build forecasting into operational rhythm:
-
Daily
Morning manager reviews today's forecast, makes minor adjustments, confirms staffing
-
Weekly
Review forecast accuracy, identify misses, adjust parameters
-
Monthly
Deep dive on waste trends, labor efficiency, rebasing if needed
-
Quarterly
Full system audit, vendor performance review, team training refresh
Assign ownership clearly. Someone needs to own forecast accuracy like they own food safety. Without accountability, systems drift.
The Path Forward
Restaurant AI forecasting isn't about replacing intuition with algorithms. It's about giving your intuition better information. When you know with 85% certainty what tomorrow's lunch rush looks like, you can focus on making that rush exceptional instead of scrambling to survive it.
Start small. Pick produce or FOH scheduling. Run a contained pilot. Measure everything. Learn what works for your specific operation. Expand gradually, keeping your team involved at every step.
The restaurants thriving five years from now won't necessarily have the best food or ambiance. They'll be the ones who learned to predict and prepare for demand accurately, consistently, profitably. AI forecasting isn't the whole answer, but it's becoming as essential as a good POS system.
Ready to elevate your restaurant operations?
Join 2,000+ restaurants using Dineoly to enhance efficiency, increase table turnover, and delight diners.