
You know that sinking feeling when your POS shows 47 pounds of ribeye in stock, but the walk-in has maybe 30? That gap between what your system thinks you have and what's actually on the shelf costs most restaurants 2-4% of total food revenue monthly. Not from one big theft or spoilage event—from the slow drift that happens when nobody's watching closely enough.
The painful part isn't even the money disappearing. It's discovering the problem three weeks later when you can't figure out if it was theft, over-portioning, receiving errors, or just bad record-keeping. By then, the trail's cold and the shrinkage has probably spread to other items.
Most restaurant managers try to fix this with monthly full counts. That's like checking your bank account once a month and hoping to catch fraud. Too much time passes between checks, variances get huge, and investigating becomes nearly impossible.
Why traditional inventory approaches fail restaurants
Restaurant inventory has unique challenges that standard retail counting methods weren't designed for. Your ribeye gets portioned into different sizes. Your tomatoes go into dozens of recipes. Your bar has partial bottles that bartenders eyeball differently. A clothing store counts shirts—you're tracking ingredients through multiple transformations.
The standard approach most restaurants follow: count everything monthly, panic at the variances, blame the kitchen staff, implement stricter portion controls for two weeks, then slide back to normal. The variances creep back up. Rinse and repeat.
This cycle happens because monthly counts create information deserts. Too much activity happens in 30 days to pinpoint where losses occur. Was it the weekend crew over-pouring? The Wednesday delivery that came up short? The new prep cook cutting steaks too thick? Without frequent data points, you're guessing.
Building exception-driven counts that actually work
Exception-driven inventory focuses your counting effort where problems actually happen. Instead of counting everything equally, you count high-risk items frequently and stable items occasionally.
Eliminate operational bottlenecks effortlessly.
Dineoly helps you manage every reservation, order, and staff shift seamlessly.
- Unified reservation and order management
- Real-time staff scheduling
- Inventory and sales tracking
No credit card required
-
1. Daily counts (5-10 items) Premium proteins (ribeye, filet, lobster), top-shelf liquor, items showing >10% variance in last week
-
2. Twice-weekly counts (15-20 items) All proteins over $8/pound, wine bottles over $40 cost, high-volume prep ingredients, previous problem items
-
3. Weekly counts (30-40 items) All bar inventory, cheese and dairy, fresh produce, items with 5-10% recent variance
-
4. Monthly counts (everything else) Dry goods, paper products, cleaning supplies, frozen vegetables, condiments
This tiered approach means you're counting about 25 items daily instead of 300 monthly. Takes 15 minutes instead of 4 hours, and catches problems while they're still investigable.
Setting variance thresholds that trigger action
Raw variance percentages don't tell the whole story. A 10% variance on salt means nothing. A 10% variance on tenderloin demands immediate investigation. Your thresholds need to reflect both percentage and dollar impact.
Most operators make the mistake of setting uniform thresholds—like investigating anything over 5% variance. This floods you with noise from low-value items while potentially missing smaller percentage variances on expensive products.
Create a two-dimensional threshold matrix:
| Item Value | Variance % Trigger | Dollar Trigger |
|---|---|---|
| Under $20/unit | 15% | $25 |
| $20-50/unit | 10% | $35 |
| $50-100/unit | 7% | $40 |
| Over $100/unit | 5% | $50 |
| Alcohol (any) | 8% | $30 |
Whichever threshold hits first triggers the investigation. A $15 bag of flour needs 15% variance OR $25 loss. A $75 case of ribeye only needs 5% variance OR $50 loss.
This matrix catches the problems that matter while filtering out statistical noise from low-value items. You'll investigate 8-12 items weekly instead of drowning in 50+ minor variances that don't impact your bottom line.
Track your investigation outcomes for three months, then adjust thresholds. If you're investigating too many items that turn out fine, raise thresholds slightly. If you're missing problems that surface later, lower them.
Investigation workflows that find root causes
When a variance crosses your threshold, the investigation needs to happen fast and follow a consistent process.
Random questioning and finger-pointing doesn't find problems—it just damages morale.
-
1. Hour 1-2
Data verification
- Whoever discovered the variance first verifies the numbers. Recount the item. Check the POS for recent sales. Verify recent invoices. Sometimes the variance is just bad math or a receiving error not entered yet. About 30% of triggered investigations resolve here. -
2. Hour 2-4
Transaction review
- If the variance is real, pull all transactions involving that item for the count period. Look for patterns: voids and comps around that item, unusual portion sizes rang up, items sold but not depleted from inventory, prep records showing unusual usage. -
3. Hour 4-8
Staff interviews
- Talk to everyone who handled that product during the variance period. Not interrogations—conversations about process. "Walk me through how you portioned the ribeyes on Saturday." Often you'll discover process variations you didn't know existed. Maybe the night crew uses a different scale. Maybe servers are ringing items wrong. -
4. Hour 8-24
Process observation
- Watch the actual workflow around that item during the next shift. You'd be surprised how often the official process and reality diverge. That 6-ounce pour your bartenders swear they're doing? Watch them during rush—it's probably 7-8 ounces. -
5. Day 2
Resolution documentation
- Document what you found, what you changed, and who's responsible for monitoring it. Without documentation, you'll investigate the same problem monthly and never remember what you tried before.
Day 2: Resolution documentation - Document what you found, what you changed, and who's responsible for monitoring it. Without documentation, you'll investigate the same problem monthly and never remember what you tried before.
Assigning clear ownership for investigations
Investigations fail when nobody owns them. "The management team" investigating variances means nobody investigates variances. Each variance needs one person responsible for driving it to resolution.
Shift supervisor (first responder): Performs the count, identifies variances over threshold, does immediate recount verification, logs the variance in tracking system, assigns to appropriate manager within 2 hours.
Department manager (investigator): Kitchen manager owns food variances. Bar manager owns beverage variances. They have 24 hours to complete transaction review, conduct staff interviews, identify root cause or escalate, document findings.
General manager (resolver): Reviews all investigations weekly, resolves disputes between departments, approves process changes, handles investigations involving potential theft, reports patterns to ownership.
Owner/operations director (systemic fixes): Reviews monthly variance trends, approves technology or equipment solutions, makes hiring/firing decisions based on investigations, adjusts variance thresholds based on data.
This structure means every variance has a clear path from detection to resolution. No confusion about who does what. No investigations dying because nobody followed up.
Sample count schedules for different volume levels
Your count schedule needs to match your operation's complexity. A 50-seat casual spot needs different rigor than a 200-seat fine dining restaurant.
Small operation (Under $1M revenue, 50-75 seats): Monday morning gets the weekend alcohol recap (15 minutes) covering all open bottles, beer inventory, and wine by glass bottles. Wednesday morning means protein check (10 minutes) for all proteins and expensive cheese. Friday afternoon brings pre-weekend verification (20 minutes) of top 20 revenue items and all previous week variances. Sunday close requires full bar count (30 minutes). Monthly everything else takes 2-3 hours. Total weekly time: About 75 minutes.
Medium operation ($1M-3M revenue, 75-150 seats): Daily opening requires high-risk quick count (15 minutes) of premium proteins, top-shelf liquor, and yesterday's variance items. Tuesday/Thursday department counts (45 minutes each)—Tuesday covers full bar and beverages, Thursday handles all proteins and dairy. Saturday morning brings prep verification (30 minutes) checking prep levels vs projected sales, special event items, and weekend specialty ingredients. Weekly rotating full section (2 hours) cycles through dry goods, frozen, paper/supplies, and full verification. Total weekly time: About 4 hours.
Large operation (Over $3M revenue, 150+ seats): Daily counts become departmental responsibility. Morning shift (20 minutes) handles receiving verification against invoice, previous day variance items, and premium protein levels. Afternoon shift (15 minutes) covers bar setup verification, prep level check, and special event items. Night close (20 minutes) manages bar speed rail and wells, walk-in organization check, and waste log verification. Twice weekly departments (90 minutes each) split between Monday/Thursday full bar and wine, Tuesday/Friday kitchen proteins and seafood, and Wednesday/Saturday produce and dairy. Total weekly time: About 8 hours spread across team.
When cycle counts reveal systemic problems
Sometimes your investigations keep finding the same issues. Three variances in chicken breast portions. Four investigations showing beer pours are off. Multiple counts catching receiving errors. These patterns indicate systematic failures, not individual mistakes.
When you see repeated variances in the same category, stop investigating individual instances. Start looking at the system creating them. Usually it's one of five core problems:
Training gaps where staff learned different methods from different trainers create compound variance.
Equipment problems hiding behind human error—that portioning scale that "sometimes" reads wrong creates daily variances.
Process ambiguity leaves room for interpretation where "medium dice" means different things to different cooks.
Recipe scaling errors multiply during busy periods when sauce recipes perfected for 20 portions break down at 100.
Receiving/storage failures cascade through operations creating information fog where shrinkage thrives.
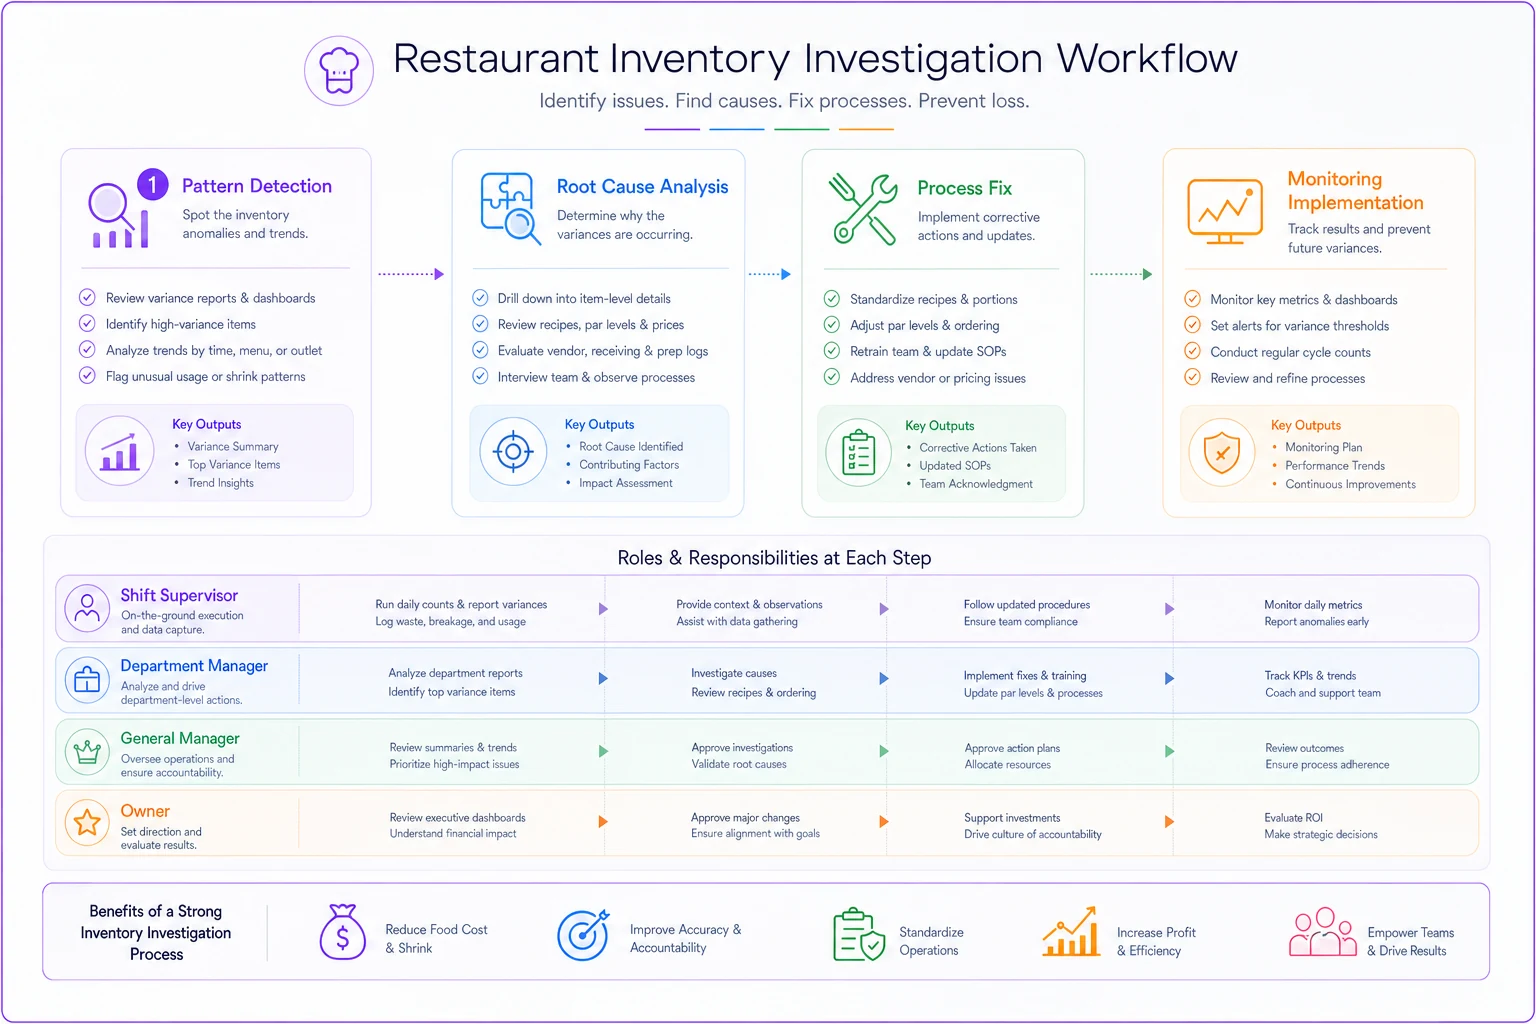
Use this diagram to align your investigation steps and responsibilities so the team can follow a single repeatable process.
Investigation templates that drive consistency
Generic investigation forms lead to generic findings. "Variance: 10 pounds chicken. Cause: Unknown. Action: Will monitor." These investigations waste everyone's time without preventing future losses.
Build specific templates for your common variance categories. Protein variance investigations need actual count vs system, last three receiving records, portion audit of 10 random plates, prep waste for last 5 days, sales mix analysis, temperature log compliance, staff interviewed, process observed, root cause, correction implemented, and follow-up date.
Bar variance investigations require item and size, pour test results for 5 pours, POS rings vs actual pours observed, spillage log entries, comp/void analysis, bartender schedules during variance, camera review notes if applicable, training records check, finding, and action taken.
Produce variance investigations track item and expected vs actual, prep utilization review, recipe adherence check, spoilage/waste log, storage temperature verification, FIFO compliance, delivery quality for last 3 orders, menu mix impact, conclusion, and preventive measure.
These templates force investigators to check the right things in the right order. They can't skip steps or take shortcuts. More importantly, they build a database of investigation outcomes you can analyze for patterns.
Making variance data drive operational improvements
Tracking variances without analyzing patterns wastes the intelligence you're gathering. Most restaurants collect variance data then file it away. The real value comes from trend analysis that reveals operational weaknesses.
Every month, analyze your variance data across four dimensions: by item category to see if proteins are consistently over or produce under, by day of week where Thursday variances might indicate Wednesday delivery problems, by staff member for training opportunities rather than punishment, and by dollar impact using Pareto analysis showing 20% of items typically drive 80% of variance dollars.
This analysis transforms your exception-driven counts from a loss prevention tool into an operations improvement engine. You're not just catching problems—you're systematically eliminating their causes.
Software automation in modern inventory management
Manual counts and investigations work, but they're exhausting to maintain. The discipline required to sustain exception-driven inventory usually breaks down after a few months when managers get busy or staff turns over.
Modern AI-powered operational software changes this. These platforms automate the tedious parts while keeping humans in control of decisions. The software tracks your count schedules, automatically flags variances over threshold, assigns investigations based on your rules, and follows up on overdue items. Instead of remembering what to count when, managers get a daily task list.
The real improvement comes from pattern recognition that humans miss. Software spots that Tuesday receiving variances happen with one specific driver. Or that bartender schedule combinations correlate with liquor variances. These insights hide in the data until AI automation surfaces them.
Integration between POS, purchasing, and inventory systems eliminates most data entry errors—a major source of false variances. When your ribeye sells, inventory depletes automatically. When purchases arrive, counts update immediately. The system maintains perpetual inventory that your cycle counts verify rather than rebuild.
This isn't about replacing managers with technology. It's about giving managers better tools to catch problems faster. Instead of spending hours counting and calculating, they investigate and fix root causes. The software handles the mundane tracking so humans can focus on improvement.
Building momentum with small wins
Don't implement everything at once. Start with your highest-value, highest-risk items—probably proteins and liquor. Get those under control first. Run that focused program for a month, document the savings, then expand.
Week 1-2 means identifying your top 10 variance items from the last quarter. Set up daily counts just for those. Assign clear owners. Run investigations on every variance, no matter how small. Week 3-4 adds your next tier—probably another 20-30 items for twice-weekly counts while refining your investigation process based on what you learned from the top 10.
Month 2 brings full tiered counting schedule implementation. Train all managers on investigation procedures. Start tracking patterns. Month 3 adjusts thresholds based on data, eliminates counts that never vary, increases frequency on problem areas, and begins systematic improvements based on investigation patterns.
By month 4, you'll have variance data that reveals exactly where your operation leaks money. More importantly, you'll have a system that catches new problems before they become expensive habits.
Start with a top-10 list from your last quarter and keep daily counts small—it's easier to sustain and proves value quickly.
Most restaurants implementing this approach see shrinkage drop from 3-4% to under 2% within six months. On $2M in food revenue, that's $20,000-$40,000 annually straight to your bottom line. The time investment—maybe 10 hours weekly spread across your team—pays for itself in the first month.
The hard part isn't setting up the system. It's maintaining the discipline when things get busy. Building it gradually matters. Each small win—catching a receiving error, fixing a portioning problem, eliminating a theft opportunity—reinforces the value and builds organizational momentum.
Your inventory variance isn't a mysterious force. It's dozens of small problems compounding. Exception-driven counts with clear investigation procedures and AI-assisted tracking help you find and fix those problems systematically. The shrinkage doesn't disappear overnight, but it stops growing immediately and shrinks steadily as you eliminate root causes. Restaurants that thrive long-term aren't the ones that never have problems. They're the ones with systems to catch and fix problems quickly. Exception-driven inventory gives you exactly that—a sustainable system that guards your margins without burning out your team.
Ready to elevate your restaurant operations?
Join 2,000+ restaurants using Dineoly to enhance efficiency, increase table turnover, and delight diners.