
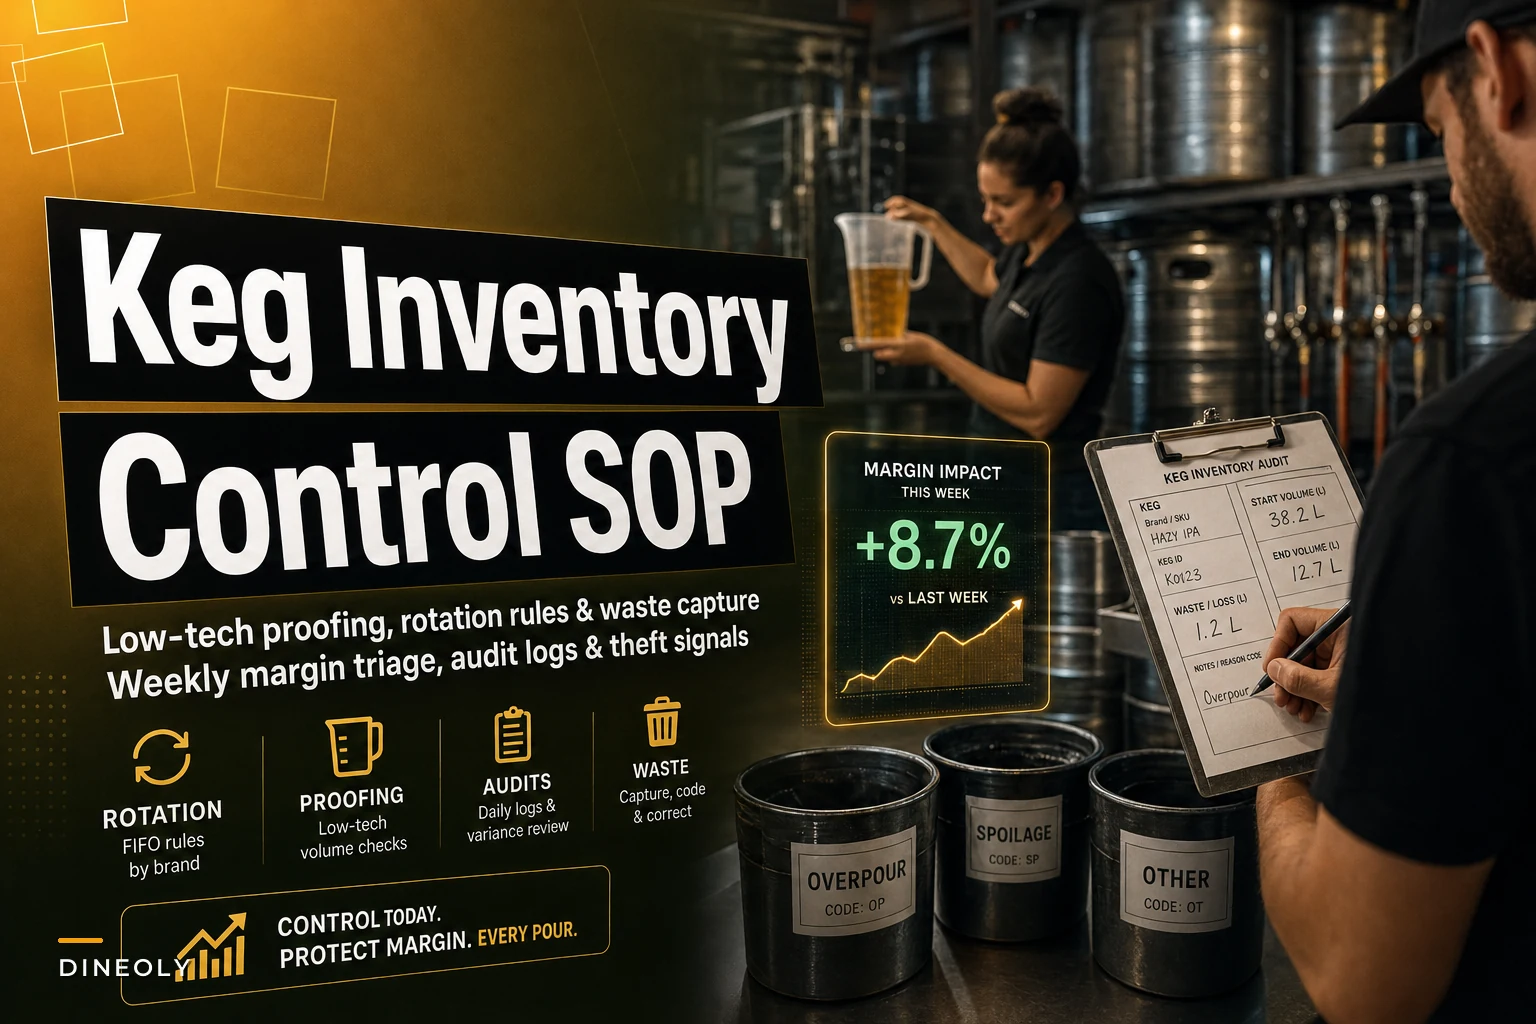

Draft beer is one of the only product categories in a restaurant where a healthy chunk of what you paid for literally disappears into foam, line cleaning, overpours, and the occasional "one for me." Most operators don't notice because the losses hide inside a pour cost that looks fine on paper. A 22% beverage cost can conceal a 40% draft-specific loss if your bottled and canned margins are propping up the average.
This is a draft-only SOP. No sensors, no flow meters, no software required to start. Just a daily proofing routine, labeled waste buckets, volume logs, rotation rules, and a weekly margin triage that turns all of it into something you can actually act on. If you already run tight cycle counts on your dry and walk-in inventory — covered in our shrinkage investigation workflow — this fits right alongside it as the draft-specific layer most places skip.
Why draft loss stays invisible
A standard half-barrel holds 1,984 ounces — roughly 124 sixteen-ounce pints before you account for foam. But nobody pours 1,984 clean ounces out of a keg. You lose some to the first foamy pulls after a tap change, more to line cleaning if you flush with beer, more to overpours during a rush, and a meaningful amount to bartenders who top off a short pour and dump the first attempt.
None of that loss has a receipt. When a case of steaks goes missing, somebody counts cases. When 80 ounces vanish from a keg, there's no case to count — just a slightly-emptier-than-expected keg that nobody weighed. So the loss rolls into pour cost, pour cost gets blended with bottles and wine, and the number on the P&L looks survivable.
What you tend to see across a lot of bar programs is that operators feel something is off — "we should be making more on draft than this" — but they can't localize it. They don't know if it's foam, theft, a miscalibrated regulator, or stale product getting dumped. The whole point of the routine below is to separate those four causes so you're not guessing.
The daily proofing routine (10 minutes, open and close)
Proofing a keg system just means confirming that what left the keg matches what got rung up, within tolerance. You don't need a scale for the daily version — you need a consistent beginning and ending volume read plus labeled waste capture. Scales come in later for the weekly triage.
Eliminate operational bottlenecks effortlessly.
Dineoly helps you manage every reservation, order, and staff shift seamlessly.
- Unified reservation and order management
- Real-time staff scheduling
- Inventory and sales tracking
No credit card required
Opening read
-
Walk the line. For each active tap, note the keg's position in rotation (more on rotation below) and whether the line was cleaned overnight.
-
Record a beginning volume estimate for any keg that's partially tapped. For kegs you're weighing, log the weight. For eyeball-only setups, use the regulator-off tilt test and mark it as full / ¾ / ½ / ¼ / near-empty. Consistency matters more than precision here.
-
Confirm regulator PSI against your target for each product. A regulator that's crept up 3–4 PSI overnight is a foam factory, and foam is loss.
During service — the waste buckets
This is the piece almost nobody does, and it's the single highest-value habit in the whole SOP.
-
"LINE / FOAM" — first-pull foam, line-clean beer, and tap-change waste.
-
"VOID / REMAKE" — any poured beer that got dumped because it was wrong, flat, returned by a guest, or overpoured.
Bartenders pour waste into the correct bucket instead of the drain. At close, you measure each bucket in ounces and log it. That's it. The reason this works is that it converts invisible loss into a measured number you can trend. A bar dumping 200+ ounces a night into "VOID / REMAKE" doesn't have a foam problem — it has a training or theft problem, and now you can see it.
Closing read
-
Record the ending volume for each keg using the same method as the open.
-
Measure and log both waste buckets.
-
Pull the POS draft sales by product for the day, converted to ounces poured.
-
Note any keg that blew mid-shift and the approximate time, because a keg that blows early distorts the day's math.
Proofing a keg system just means confirming that what left the keg matches what got rung up, within tolerance.
The volume log that ties it together
Your beginning/ending logs only mean something when you line them up against POS ounces sold and measured waste. Here's the daily reconciliation, per product:
Expected depletion = (Beginning volume − Ending volume) Accounted ounces = POS ounces sold + LINE/FOAM waste + VOID/REMAKE waste Unexplained variance = Expected depletion − Accounted ounces
If your unexplained variance is small, your losses are at least categorized. If it's large and positive — meaning the keg emptied faster than sales plus logged waste can explain — that gap is your theft-and-overpour indicator. It's the number that matters most, and it's the one almost no draft program isolates.
| Metric | Weak program | Tight program |
|---|---|---|
| Daily unexplained variance (per half-barrel) | Unknown / not tracked | Under ~40 oz |
| Logged waste as % of keg | Invisible, blended into pour cost | 3–6%, categorized by cause |
| Keg turn tracked per SKU | No | Yes |
| Theft indicator | Discovered at inventory, maybe | Flagged same-week |
| Regulator PSI check | Occasional | Daily, logged |
The right column isn't aspirational. It's what the routine produces in about two weeks of consistent logging.
Rotation rules that actually get followed
Rotation problems show up as dumped kegs — product that went flat or oxidized before it sold because a fresher keg got tapped first. On slower draft lines this is pure margin walking out the door.
-
Tap oldest first, always. Date every keg the moment it's received, on the chime, with a paint pen. Received date, not the brewery's canning date — track both if you can, but the received date drives rotation.
-
One keg deep per SKU on the line. Don't stage two of the same product cold unless volume justifies it.
-
Slow movers get a kill date. Any keg of a low-volume SKU that's been tapped longer than its freshness window (commonly around 45–60 days for most styles, far less for hazy IPAs) gets flagged for a feature, a promo, or a staff-pour decision — not another week of slow oxidation.
-
No silent swaps. If a bartender taps out of rotation for any reason, it gets a line in the log explaining why. Silent swaps are where rotation discipline dies.
Date kegs on the chime the moment they're received so rotation is visible and hard to ignore.
The operators who nail this treat keg dates the same way a tight kitchen treats prep dating — a visible, non-negotiable habit rather than a suggestion.
Weekly beverage-margin triage
Daily logs catch problems. The weekly triage is where you decide what to do about them. Run it the same day each week, right after you reconcile draft counts.
-
Keg turns — how many kegs of this SKU you emptied this week, or the fraction of one.
-
Cost per ounce — keg cost ÷ usable ounces (use ~1,920 for a half-barrel to build in realistic foam loss, not the full 1,984).
-
Revenue per ounce — POS draft revenue for that SKU ÷ ounces sold.
-
Margin per ounce and weekly margin dollars (margin per ounce × ounces sold).
-
Total logged waste % and unexplained variance % for the week.
Now triage into three buckets:
-
Winners (high turns, healthy margin) protect the line position, make sure you never run out. These fund the program.
-
Margin leaks (healthy turns, poor margin or high variance) this is where overpour, theft, and foam live. Dig into the variance number before you touch the price.
-
Dead weight (low turns, slow depletion) rotation and freshness risk. Feature it, cut it, or move it to a smaller format.
The reason you tie keg turns to margin in the same view is that a high-margin beer that barely moves can be worth less to you than a thinner-margin beer that turns four kegs a week. Pricing decisions made on margin-per-ounce alone, without turns, tend to quietly starve your best performers.
Reading theft vs. foam in the variance number
-
Variance spikes on specific shifts → people, not equipment. Cross-reference the schedule.
-
Variance steady and spread across all shifts → equipment or process. Check PSI, line temp, glassware chilling (frosted glasses cause foam).
-
VOID/REMAKE bucket high but unexplained variance low → honest waste problem. Fixable with training.
-
VOID/REMAKE bucket low but unexplained variance high → beer is leaving without being rung up. That's your flag.
None of these heuristics are foolproof, but they give you a direction to investigate instead of just staring at a bad pour cost number.
Here's a simple visual to show the weekly triage workflow and decisions.
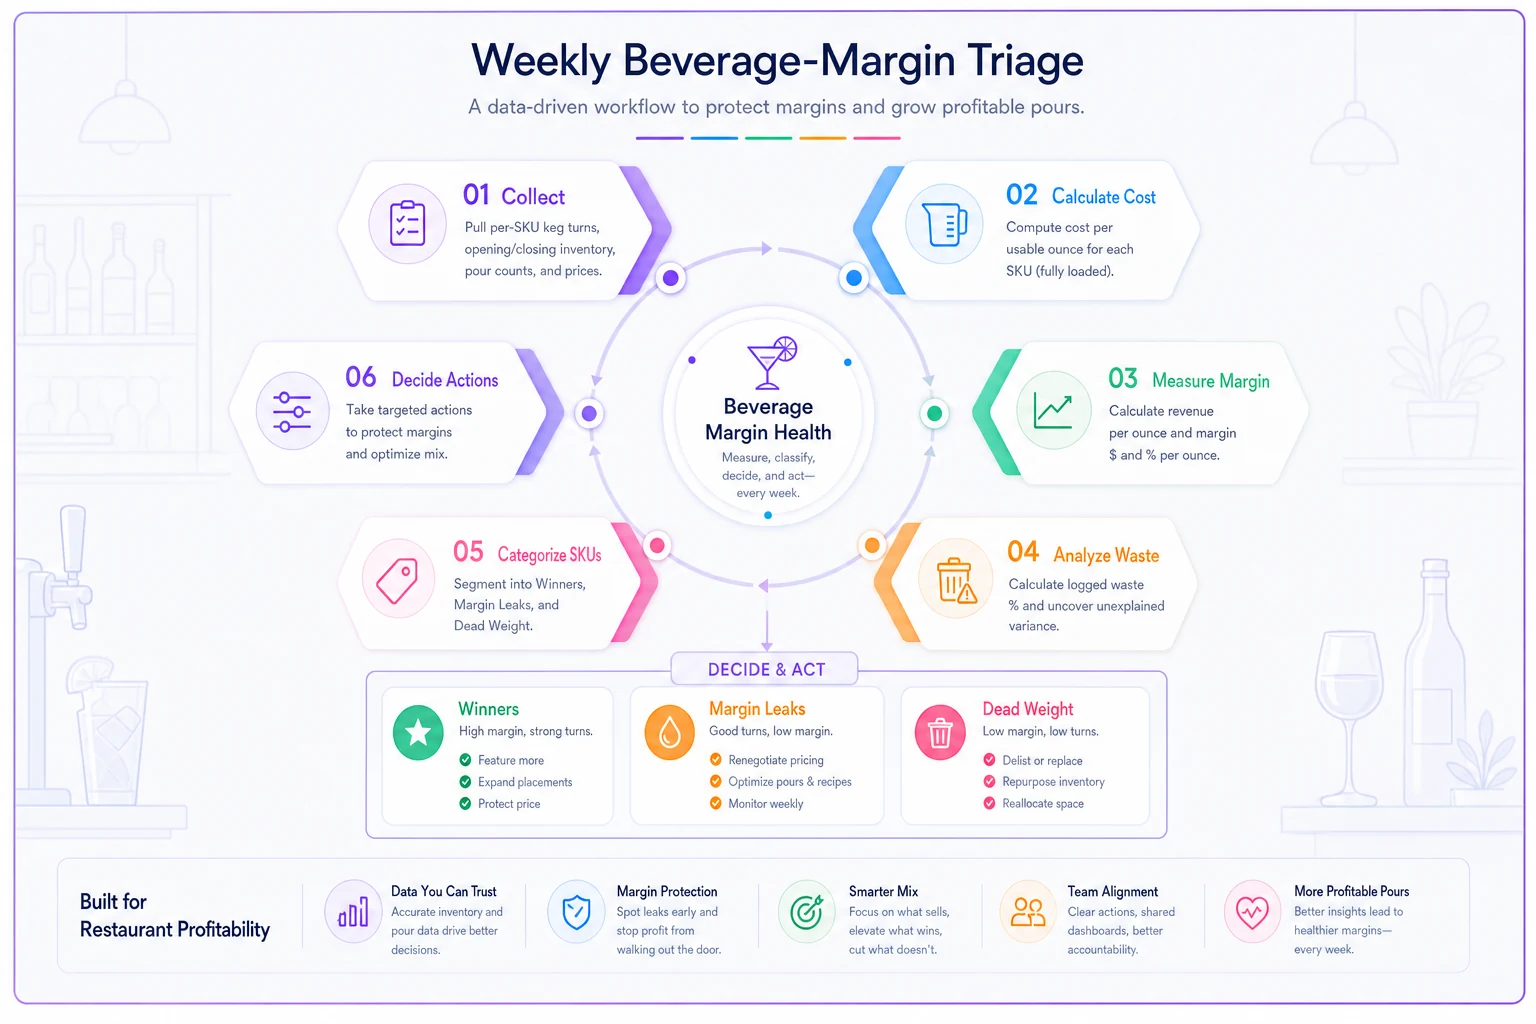
Use this workflow to make consistent decisions each week rather than reacting to a single bad number.
Sample audit worksheet
Keep it on a clipboard at the bar. Digitize later if you want; paper first, because paper gets filled out.
Daily Keg Proofing Sheet — per tap
-
Date / Shift / Bartender initials
-
SKU & keg received date
-
Regulator PSI (target / actual)
-
Beginning volume (weight or full/¾/½/¼)
-
Ending volume
-
POS ounces sold
-
LINE/FOAM waste (oz)
-
VOID/REMAKE waste (oz)
-
Keg blew? (Y/N + approx. time)
-
Unexplained variance (auto-calc)
-
Manager initials
Weekly Margin Triage Sheet — per SKU
-
Keg turns this week
-
Cost per usable oz
-
Revenue per oz
-
Margin per oz
-
Weekly margin $
-
Logged waste %
-
Unexplained variance %
-
Bucket
Winner / Leak / Dead weight
-
Action taken
The cost-per-ounce math here plugs directly into the same logic as your plate-level recipe costing SOP — draft beer is just a liquid recipe with a yield factor, and the foam allowance is your waste factor. The worksheet is the connective tissue between daily proofing and weekly decision-making.
A real scenario
A neighborhood gastropub running 14 taps couldn't figure out why beverage cost sat around 31% when their menu pricing implied closer to 24%. Bottle and wine margins were fine, so the problem had to be draft.
They ran the daily proofing routine for three weeks. The waste buckets told the story pretty quickly: the LINE/FOAM bucket was reasonable — foam wasn't the issue. But the VOID/REMAKE bucket was low and unexplained variance was running roughly 90–130 ounces a night on just two of their fourteen taps, both high-volume IPAs. Steady across every shift at first glance, but when they lined variance up against the schedule, two closing shifts were carrying most of it.
It wasn't dramatic theft — it was systematic overpouring on the two busiest taps, plus a handful of unrung pours during rushes. They retrained on pour counts, moved the two IPAs to spots under the manager's sightline, and started logging PSI daily. One regulator had crept to 16 PSI, which was driving extra foam on top of everything else.
Over the next two months, draft cost came down a few points — somewhere around $1,400–$1,800 a month back in margin on those two SKUs alone. Nothing exotic. Clipboard, buckets, and someone actually reading the numbers each week.
When this makes sense — and when it doesn't
Run the full routine if: draft is a meaningful share of your beverage revenue (say, six-plus taps and double-digit percent of bar sales), your blended pour cost looks "fine" but you suspect it's hiding something, or you've had turnover behind the bar and want a control that doesn't depend on trusting any one person.
Scale it down if: you run two or three taps of fast-moving product. In that case, skip the per-SKU weekly triage and just run the waste buckets plus a weekly keg count. The full worksheet is overkill for a low-tap program.
Who should not bother with daily weighing: very high-volume beer bars where kegs blow daily anyway. Depletion is self-evident there — your effort is better spent on PSI discipline, glassware temperature, and overpour training than logging volumes that reset every shift.
One honest caveat: this routine only works if the ending read and the waste measurement actually get done every single night. A half-followed proofing sheet is worse than none, because it produces variance numbers you can't trust and then everyone stops believing the whole system. Treat the close-out log with the same seriousness you'd treat a cash drop. If your team already handles time-boxed closing tasks well — the same discipline behind a tight banquet prep timeline — this slots into the existing close without much friction.
Where software earns its place (later, not first)
Start on paper. Once the routine is a habit and you trust the numbers, the obvious next step is letting the math and the trending run themselves — logging daily volumes and POS ounces once, and having the unexplained-variance calculation, the per-SKU margin triage, and the by-shift variance flags generate automatically instead of someone rebuilding a spreadsheet every Monday.
That's where an AI-assisted operational platform actually helps: not to replace the waste buckets or the clipboard, but to watch the trend lines and flag the keg, shift, or regulator that's drifting before it shows up in a quarterly P&L. The habit catches the loss; the automation just makes sure a busy manager never misses the pattern. Build the discipline first — the tooling only amplifies a routine that's already working.
That's where an AI-assisted operational platform actually helps: not to replace the waste buckets or the clipboard, but to watch the trend lines and flag the keg, shift, or regulator that's drifting before it shows up in a quarterly P&L. The habit catches the loss; the automation just makes sure a busy manager never misses the pattern. Build the discipline first — the tooling only amplifies a routine that's already working.
Ready to elevate your restaurant operations?
Join 2,000+ restaurants using Dineoly to enhance efficiency, increase table turnover, and delight diners.