


Most restaurant loyalty programs can't answer a basic question: did this guest come back because of the program, or would they have come back anyway? And if you can't answer that, every dollar you spend on points, perks, and "we miss you" texts is a guess.
The attribution problem is messier in restaurants than in almost any other business. A guest discovers you through a reservation, gets a bad table, has it recovered by a host, enrolls in your loyalty program at the POS, gets a birthday offer six weeks later, redeems it on a slow Tuesday, and then stops coming for three months. Somewhere in that chain, real value was created or destroyed. Figuring out where is the whole game.
This is a framework piece — not "send more emails," but how to build a restaurant loyalty revenue attribution framework that connects cohorts, attribution windows, and measurement recipes to the operational reality of fulfillment and recovery. The goal is to model lifetime value, measure true lift, and avoid the margin surprises that quietly eat your promo budget.
Why restaurant attribution breaks where retail attribution doesn't
In e-commerce, attribution is relatively clean. A click leads to a cart leads to a purchase, timestamped inside one system. Restaurants don't have that luxury. Guest data is scattered across the reservation platform, the POS, the loyalty app, the online ordering provider, and sometimes a separate email tool. None of them share a guest ID by default.
So when someone asks "what's the ROI on our loyalty program," the honest answer at most restaurants is: nobody actually knows. The loyalty vendor reports redemption rates. The marketing tool reports open rates. The POS reports comps. But nothing stitches a single guest's full journey together, which means nobody can separate correlation from causation.
The pattern that shows up constantly: a restaurant launches a loyalty program, same-store sales tick up a few points, everyone's happy. But sales were already trending up — new menu, better weather, seasonal bump. The loyalty program takes credit for lift it didn't create. Six months later, margins are soft and nobody can explain why the discount line keeps climbing.
The fix isn't a fancier dashboard. It's a disciplined measurement structure built before you spend the money.
Start with cohorts, not campaigns
The single biggest shift is thinking in cohorts instead of campaigns. A campaign asks "how did this email perform." A cohort asks "how does this group of guests behave over time, and how does one group differ from a comparable group that didn't get the treatment."
Eliminate operational bottlenecks effortlessly.
Dineoly helps you manage every reservation, order, and staff shift seamlessly.
- Unified reservation and order management
- Real-time staff scheduling
- Inventory and sales tracking
No credit card required
A cohort is just a group of guests who share a starting condition and a start date. Examples:
-
Everyone who enrolled in loyalty in March
-
Everyone whose first visit happened during a specific promotion
-
Everyone who experienced a service recovery (a comped item, a manager apology, a re-fired entrée) in Q2
-
Everyone who came through online ordering first vs. dine-in first
The power comes from comparing cohorts against a holdout — a matched group that didn't get the loyalty treatment. If your March enrollees spend more over the next 90 days than a comparable group of non-enrollees who visited the same month, that gap is your lift. Without the holdout, you're measuring the behavior of people who were already your best guests, because engaged guests enroll in loyalty programs at higher rates. That self-selection bias is the number-one reason restaurants overstate loyalty ROI.
Hold back around 5–10% of eligible guests as a randomized holdout to get a clean test.
One operational note worth taking seriously: hold back a small, randomized slice of eligible guests from your loyalty offers — somewhere around 5–10%. It feels wrong to "leave money on the table," but that holdout is the only clean way to know if the program works at all. Treat it as the cost of knowing the truth.
Attribution windows: the decision that quietly changes every number
An attribution window is the time period during which you credit a visit or dollar to a specific action. Pick 7 days and your birthday offer looks weak. Pick 90 days and it looks heroic — but you're probably crediting visits that would've happened regardless.
| Loyalty / recovery action | Reasonable attribution window | Why |
|---|---|---|
| "We miss you" win-back offer | 14–30 days | Short intent cycle; if it works, it works fast |
| Birthday / anniversary reward | 30–45 days | Guests redeem around the date, not instantly |
| Service recovery handoff | 60–90 days | You're measuring restored trust, which shows up over multiple visit cycles |
| New-enrollment welcome series | 90 days | LTV behavior needs time to separate from the holdout |
| Referral reward | 30 days from referred guest's first visit | Tie the credit to the new guest's action, not the referrer's |
The recovery window deserves extra attention. When a guest has a bad experience and your team handles it well, the payoff isn't the next visit — it's whether they keep coming. A guest who was about to churn and gets properly recovered might not return for six weeks, then come back three times in the following two months. A 14-day window would score that recovery as a failure. That's why recovery attribution needs a longer horizon tied to the guest's normal visit frequency.
If your guest-feedback triage playbook is already capturing recovery events with timestamps and who handled them, you've got the raw material. The attribution layer just connects those recovery flags to subsequent spend.
The measurement recipes
A "recipe" here means a repeatable calculation you can run the same way every time, so numbers stay comparable across months and locations.
Recipe 1 — Incremental lift (the honest ROI number)
Lift = (Avg 90-day spend, treated cohort) − (Avg 90-day spend, holdout cohort) Incremental revenue = Lift × number of treated guests Operational ROI = (Incremental revenue × gross margin %) − program cost ───────────────────────────────────────────────────── program cost
Notice the gross margin multiplier. This is where most calculations go wrong — they measure incremental revenue and call it profit. If your incremental revenue came largely from discounted redemptions on low-margin items, the ROI can be negative even when revenue looks solid.
Recipe 2 — Cohort LTV (modeled, not final)
Cohort LTV = Avg visits per guest × Avg check × Gross margin % × Retention factor over the modeling period
Keep LTV modeled and clearly labeled as an estimate. A new cohort's "lifetime" hasn't happened yet. Model it on observed early behavior, then correct it as real data accumulates. Restaurants that treat projected LTV as a locked fact end up over-investing in acquisition because the model said each guest was worth more than they turned out to be.
Recipe 3 — Recovery value
Recovery value = (90-day spend of recovered guests) − (90-day spend of guests with a similar bad experience, NOT recovered)
You need both groups. The comparison isn't "recovered guest vs. happy guest" — it's "recovered vs. un-recovered after the same type of problem." That's the only way to isolate what your recovery handoff actually bought you.
A real scenario with real numbers
A two-location neighborhood Italian spot — roughly 11,000 enrolled loyalty members across both sites — ran a win-back campaign for lapsed guests (no visit in 60+ days). They'd been reporting it as a win because redemptions looked solid.
When they rebuilt it with a holdout, the picture changed. They pulled about 2,400 lapsed guests, held back roughly 240 at random, and sent the rest a $15-off-$50 offer.
-
Treated group 30-day return rate
about 18%
-
Holdout group 30-day return rate
about 12%
The real incremental return was roughly 6 points, not the 18% the redemption report implied. That's still real — around 130 extra incremental visits across the treated group — but it's a third of what they thought they'd earned.
Then the margin check. Average incremental check landed near $58, but after the $15 discount and food cost, contribution per incremental visit was closer to $19–22, not the $35+ they'd assumed. The campaign was still profitable — roughly a 2:1 operational ROI — but nowhere near the 5:1 they'd been talking up internally. More importantly, they discovered that a deeper discount tier they'd run to a sub-segment actually lost money once margin was applied, because it pulled in guests who only came for steep deals and disappeared again.
That last finding is the whole point. Without the holdout and the margin multiplier, they'd have expanded the money-losing tier.
Guardrails: how to avoid margin surprises
Attribution math is only useful if it protects margin. These are the guardrails that keep a "successful" program from quietly bleeding profit.
-
Always apply gross margin, never credit full revenue. A redeemed offer on a 70%-margin cocktail is a very different animal than one on a 25%-margin entrée special.
-
Cap discount depth by cohort value. Your highest-value guests rarely need the biggest discount. Deep offers should go to genuinely lapsed, lower-frequency guests — and even then, watch the return behavior.
-
Set a redemption-rate alarm. If redemptions spike far above forecast, that's often margin erosion, not success. Model a worst-case redemption scenario before launch.
-
Watch for subsidized regulars. The ugliest leak in loyalty programs is discounting guests who would've paid full price anyway. Track what share of redemptions come from guests who visit weekly regardless.
-
Separate acquisition cost from retention cost. Blending them hides which half of your program is actually working.
-
Re-baseline seasonally. A win-back that looks great in a slow month may just be riding the calendar.
The subsidized-regular problem is worth sitting with. A typical example: a program sends every member a monthly reward. The members who redeem most are your most frequent guests — the exact people who needed no incentive. You're paying to discount loyalty you already had, while genuinely at-risk guests ignore the offer entirely. The cohort structure exposes this immediately because high-frequency and lapsed cohorts behave nothing alike.
Connecting attribution to operations and recovery handoffs
Most frameworks skip this part: attribution isn't a marketing report, it's an operational feedback loop. The handoffs between front-of-house, kitchen, and the loyalty system are where the data either stays clean or falls apart.
If a server comps a dessert to recover a slow kitchen night but nobody flags it as a recovery event tied to that guest's profile, your recovery-value recipe has nothing to measure. If a host seats a VIP loyalty member at the worst table because the seating system doesn't surface their status, you're spending to retain guests you're simultaneously annoying. Attribution quality is downstream of operational discipline.
Here's a simple workflow to picture how those handoffs connect.
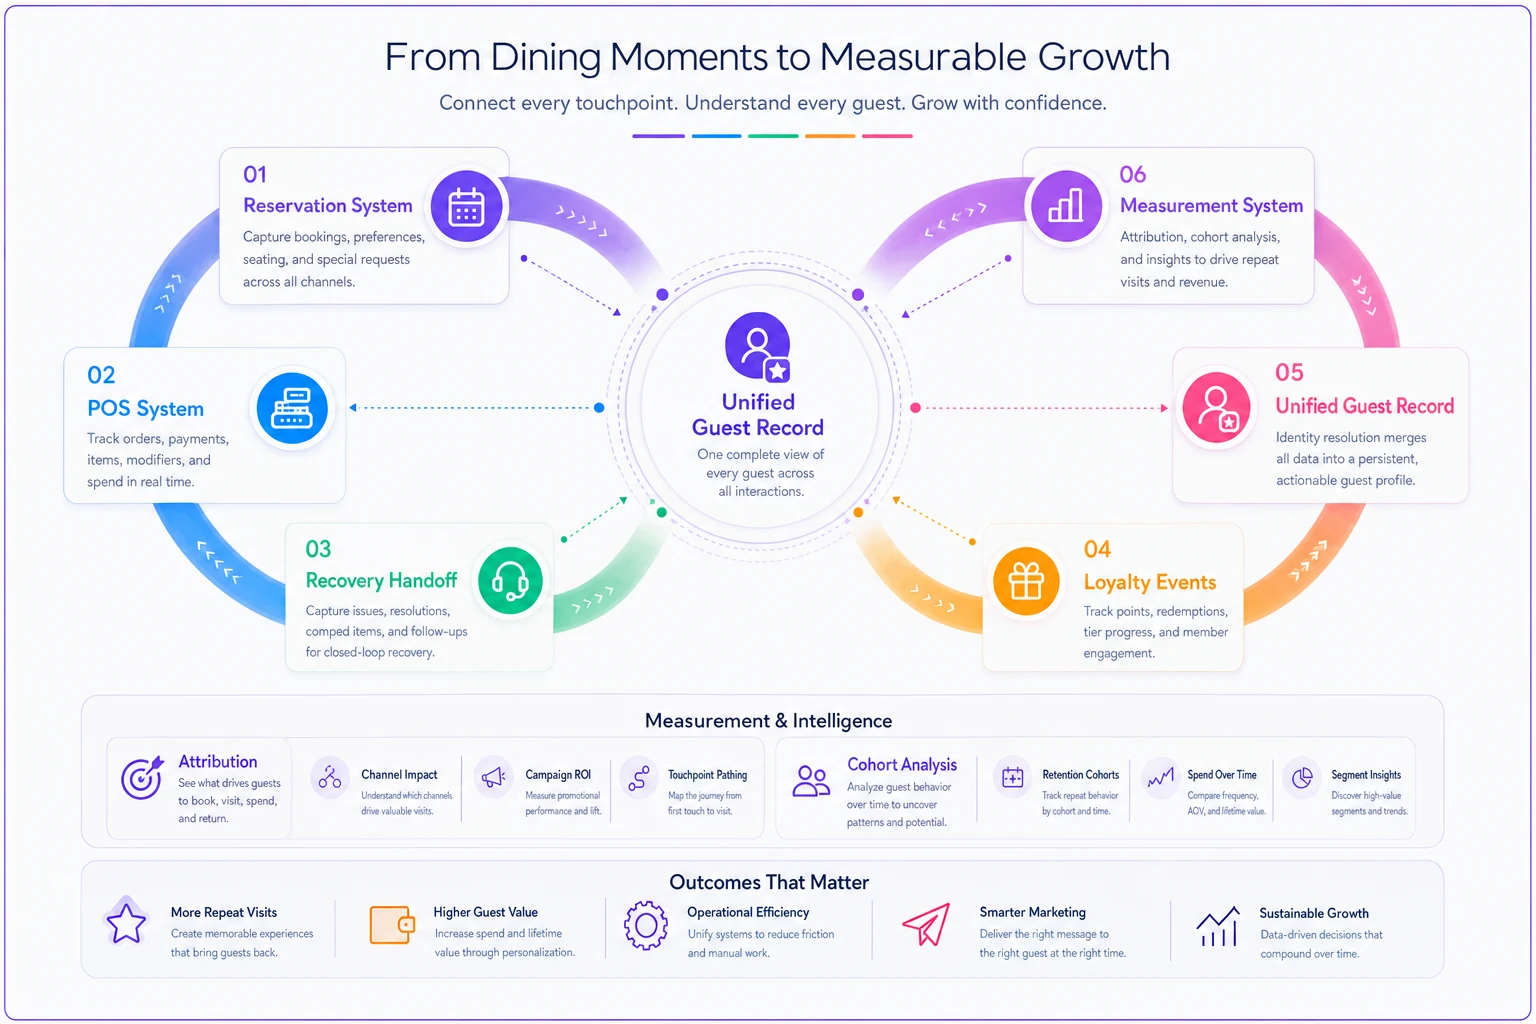
This shows how the reservation, the recovery flag, the POS check, and the loyalty event need to resolve to one guest identity so the measurement recipes can run.
This is why the framework has to sit on top of a real guest-data spine rather than a standalone loyalty app. The reservation, the recovery flag, the POS check, and the loyalty event all need to resolve to one guest identity. When they do, your customer lifecycle marketing architecture stops being a sequence of disconnected sends and becomes a measurable system — each stage with a cohort, a window, and an ROI number.
Platforms that unify these signals — tying POS checks, reservation history, recovery events, and loyalty enrollment to a single guest record — make the measurement recipes runnable instead of theoretical. The value isn't automation for its own sake; it's that the attribution math is only as good as the data plumbing underneath it. When a recovery handoff automatically stamps the guest profile, the 90-day recovery-value calculation runs itself. When those signals live in five disconnected tools, you're back to guessing.
When this framework makes sense — and when it doesn't
When it makes sense:
-
You have at least a few thousand identifiable guests, so cohorts and holdouts are statistically meaningful.
-
You're spending real money on loyalty, discounts, or win-backs and can't currently prove the return.
-
You run multiple locations and need normalized, comparable numbers across sites.
When it's overkill:
-
A single small location with a few hundred regulars where the owner personally knows the guests. The measurement overhead will cost more than it reveals.
-
A brand-new restaurant with no visit history yet. Build the data spine first; you can't cohort guests who don't exist.
Who should not start here:
If your POS, reservations, and loyalty data don't share a guest identity at all, don't start with attribution math — start with the plumbing. A sophisticated lift calculation on broken data produces confident, precise, wrong numbers. That's worse than knowing you don't know.
Putting it into practice
A sane build order rather than trying to do everything at once:
-
Unify guest identity across reservation, POS, and loyalty so one guest is one record.
-
Define 3–4 cohorts that matter to you (new enrollees, lapsed, recovered, high-frequency).
-
Assign an attribution window to each action based on its real behavior cycle, not a default.
-
Build in a holdout — small, randomized, left alone — for every major offer.
-
Run the lift and recovery recipes monthly, always with the gross-margin multiplier.
-
Model LTV as an estimate, and correct it as cohorts age.
-
Check guardrails before scaling any offer, especially deep discounts and high-redemption campaigns.
The goal isn't a prettier loyalty dashboard. It's being able to walk into a meeting and say, with a straight face: "This program generated roughly this much incremental margin, here's the holdout that proves it, and here's the one tier we're killing because it loses money." That sentence is worth more than any open rate you'll ever report.
Loyalty doesn't fail because guests don't like points. It fails because restaurants can't separate the spending they caused from the spending they'd have gotten anyway — and they keep funding the difference. A real attribution framework, built on cohorts, honest windows, and margin-aware math, is how you stop paying for loyalty you already had and start investing in loyalty you actually create.
Ready to elevate your restaurant operations?
Join 2,000+ restaurants using Dineoly to enhance efficiency, increase table turnover, and delight diners.