

Most restaurants don't have a forecasting problem. They have a data problem wearing a forecasting costume.
You can install the smartest prediction model on the market, but if your POS logs a comped meal as $0 revenue with a full food cost, or your inventory counts get entered three days late, or your labor hours live in one system and your sales live in another with no shared key between them — the model will confidently hand you garbage. And the part that stings: it won't tell you it's garbage. It'll produce a clean number, a nice-looking chart, and a manager will staff Saturday night based on it.
That's the real risk. Not that the forecast is wrong, but that it's wrong and looks right. Restaurant data governance is the boring plumbing that keeps that from happening. Nobody puts it on a conference slide, but it's the difference between a dashboard people trust and one they quietly ignore.
Why the data breaks before the math ever runs
The forecasting math is rarely the weak link. The weak link is the seam between systems.
A typical mid-size restaurant is running four or five disconnected sources: the POS, a scheduling and labor tool, an inventory or ordering system, the reservation platform, and probably a spreadsheet or two that a manager built and never told anyone about. Each of these was set up by a different person, at a different time, with different assumptions about what a "cover" or a "shift" or a "menu item" actually means.
Here's what that looks like in practice. The POS counts a table of four as one check. The reservation system counts it as four covers. The kitchen display counts it as however many entrées fired. When your forecast tries to predict "covers by daypart," which number is it learning from? If nobody decided, the answer is whichever one the integration happened to grab — a decision made by an engineer, not you.
Multiply that across voids, comps, discounts, service charges, modifier pricing, and no-show handling, and you get a dataset where every field has three plausible meanings. Models don't resolve ambiguity. They average it.
The pattern that keeps showing up: the restaurant blames the forecast ("it's always off on weekends") when the actual problem is that weekend data is dirtier than weekday data — more comps, more large parties, more manual overrides during the rush. The model isn't dumber on Saturdays. The inputs are.
Required fields: decide what every system must capture, and what it means
Governance starts with an unglamorous exercise: for each system, write down the fields you require and the exact definition of each one. Not the fields the software offers. The ones you refuse to operate without.
Eliminate operational bottlenecks effortlessly.
Dineoly helps you manage every reservation, order, and staff shift seamlessly.
- Unified reservation and order management
- Real-time staff scheduling
- Inventory and sales tracking
No credit card required
| System | Required fields | Definition that must be locked | Common failure |
|---|---|---|---|
| POS | Net sales, gross sales, comps, voids, discounts, item-level qty, daypart, order channel | Is "net sales" after comps but before tax? Is delivery counted separately? | Comps buried inside net, so cost ratios look inflated |
| Labor / scheduling | Scheduled hours, actual clocked hours, role, wage, break time | Does "labor cost" include payroll tax and tip credit or not? | Scheduled vs actual conflated, so variance is invisible |
| Inventory / purchasing | Unit of measure, count date, on-hand qty, unit cost, waste qty | Is the count date the day counted or the day entered? | UOM mismatch (case vs each) throwing cost per plate off by 10x |
| Reservations | Covers, party size, no-show flag, seated time, source | Is a "cover" a guest or a booking? | Covers and bookings used interchangeably in the same report |
| Delivery / third-party | Gross order value, commission, item mix, promo cost | Is the number pre- or post-platform commission? | Third-party revenue counted at menu price, not net payout |
The two definitions that cause the most downstream damage: net sales (because it feeds every ratio you care about) and the meaning of a "cover" (because it feeds every demand forecast). Get those two nailed down in writing, shared across managers, and enforced in how the systems are configured, and you've eliminated maybe half of all forecasting disputes before they start.
One more required-field rule people consistently underweight: every transaction needs a shared join key. A date and a location aren't enough. You need something — an order ID, a business-date stamp that's consistent across systems, a location code that matches everywhere — that lets you reliably line up sales, labor, and inventory for the same period. Without it, reconciliation becomes a manual guessing game every single week.
Reconciliation cadence: the rhythm that catches drift early
Data doesn't go bad all at once. It drifts. A new manager enters counts differently, a menu item gets re-mapped to the wrong category, a promo code gets set up with the wrong discount type. Each is small on its own. Reconciliation is how you catch that drift while it's still small.
-
Daily (5 minutes, opening manager) Confirm yesterday's POS net sales matches the deposit/settlement total. Flag any daypart with zero sales that shouldn't be zero. Confirm the reservation cover count roughly tracks POS check volume.
-
Weekly (30–45 minutes, GM) Reconcile scheduled vs actual labor hours against sales for the week. Spot-check that inventory counts were entered on time and in the right units. Review comps and voids for anything unusual — a single server with 4x the comps of everyone else is a data flag and a loss flag.
-
Monthly (1–2 hours, owner + bookkeeper) Full three-way tie-out — POS sales, bank deposits, and accounting. Reconcile theoretical food cost vs actual. Confirm menu items are still mapped to the correct categories and recipes after any menu changes.
-
Per menu change (immediate) Any time you add, remove, re-price, or re-cost an item, verify the mapping in every system before the next service. Menu changes are the single most common moment data integrity quietly breaks.
The insight isn't the schedule itself — it's that reconciliation should get lighter and more frequent as you move down, not saved up into one giant painful monthly session. A five-minute daily check catches the deposit mismatch while you still remember what happened that day. Waiting a month means you're reconstructing from memory, which nobody does well.
If you're feeding this data into a prediction model, the cadence matters even more. A phased AI forecasting pilot only works if the data feeding it gets reconciled on a schedule — otherwise the pilot "fails" and everyone blames the model, when the real problem was three weeks of mis-entered counts poisoning the training window.
A lightweight audit log you'll actually maintain
Most audit-log advice fails because it's too heavy. Nobody keeps a forensic ledger of every change in a busy restaurant. The log gets abandoned in week two, and you're back to guessing why the numbers moved.
-
Date / business date — when it happened, using your locked business-date definition
-
System changed — POS, labor, inventory, reservations, etc.
-
What changed — e.g. "re-mapped 'Lunch Special' to Entrées category"
-
Old value → new value — the before and after, even if approximate
-
Who — name, not a role
-
Why — one line. "Corrected wrong UOM," "voided duplicate check," "manual count, scanner down"
-
Affects forecast? (Y/N) — the field that makes this log worth keeping
That last field is the whole point. When your Tuesday numbers look strange three weeks from now, you filter the log to "affects forecast = Y" and you have your suspects in ten seconds instead of an hour of detective work.
Something worth noting from watching this play out across different operations: the log doesn't just help you debug. It changes behavior. Once managers know a manual override gets a name attached to it, the sloppy overrides tend to drop off on their own. The log is quietly a control, not just a record.
Failure-mode checks: assume the data will lie to you
A trustworthy dashboard is one that's suspicious of its own inputs. Instead of hoping the data is clean, you build a handful of automatic checks that raise a flag when something looks physically impossible or statistically unlikely. These are the guardrails that stop a bad number from becoming a bad staffing decision.
-
Impossible values food cost of 4% or 160%. Negative on-hand inventory. Labor hours exceeding hours the store was open. These are almost always entry or mapping errors, not real events.
-
Stale data an inventory count that hasn't updated in five days, or a POS feed that stopped syncing at 6pm and shows an empty dinner service. A forecast trained on a partial day will badly under-predict.
-
Sudden distribution shifts average check jumps 30% overnight with no menu change — usually a discount or comp field that stopped flowing correctly.
-
Volume anomalies covers reported at 3x normal, which typically means bookings got double-counted after an integration hiccup.
-
Reconciliation gaps POS net sales and bank deposit off by more than a small tolerance. Anything beyond a couple percent needs a human look before it feeds anything downstream.
The practical way to run these is with a threshold, not a judgment call. Decide in advance: "food cost outside 20–45% gets flagged," "any daypart 40%+ below its trailing average gets flagged." Thresholds turn a subjective gut-check into something a junior manager — or your software — can run every morning without needing your intuition.
This connects directly to how your dashboards should behave. A number that fails a check shouldn't be shown as a confident metric. It should show a warning state. The best restaurant KPI dashboards don't just display numbers, they tell managers what to do — and a big part of "what to do" is "don't trust this cell today, the underlying count is stale." A dashboard that hides its own uncertainty is more dangerous than no dashboard at all.
A real scenario: the 60-seat bistro that couldn't trust Saturdays
A single-location bistro, around 60 seats, had rolled out a forecasting setup to help schedule kitchen staff. Weekdays predicted fine. Saturdays were consistently off — the model kept under-staffing, and the kitchen got buried during the 7–9pm rush maybe two or three weekends a month.
The owner assumed the model just "didn't get" weekends. The actual problem showed up the moment they built a simple reconciliation check: Saturday covers in the reservation system were running noticeably higher than the check count in the POS. Large parties were being entered as a single reservation with a party size, but split across multiple checks at the table — and the integration was feeding the model check count, not covers. Every big-party Saturday looked lighter to the model than it really was.
The fix wasn't a better model. It was a locked definition ("forecast trains on covers, sourced from reservations, validated against POS check count within a tolerance"), a weekly reconciliation of the two numbers, and a failure-mode flag when they diverged by more than about 15%. Within roughly six weeks the Saturday under-staffing basically stopped. Food cost from over-prepping on nights that were actually busy also settled down — worth somewhere in the low hundreds a week that had been leaking out as waste and comped delays.
Nothing about the prediction engine changed. The governance around its inputs did.
When heavy governance makes sense — and when it's overkill
Worth doing seriously when: you're running more than one location, you're making labor or purchasing decisions off forecasts rather than gut, you've got manager turnover (definitions live in people's heads and walk out the door), or your third-party delivery mix is large enough to distort your revenue picture. At that point, undefined fields cost you real money every week.
Probably overkill when: you're a single small counter-service spot, one manager who touches everything, low menu complexity, and you're not yet automating any decisions off the data. Start with just the two things that matter most — a locked definition of net sales and covers, plus a five-minute daily deposit reconciliation. That alone catches most of the damage. Build the rest when the complexity actually shows up.
The failure pattern to avoid: an owner reads a checklist like this, tries to implement all of it in one weekend across every system, overwhelms the managers, and the whole effort collapses. Governance that isn't maintained is worse than none, because it creates a false sense that the data is clean.
Putting it together as one loop
The pieces aren't separate initiatives. They're a loop, and each one covers a weakness in the others.
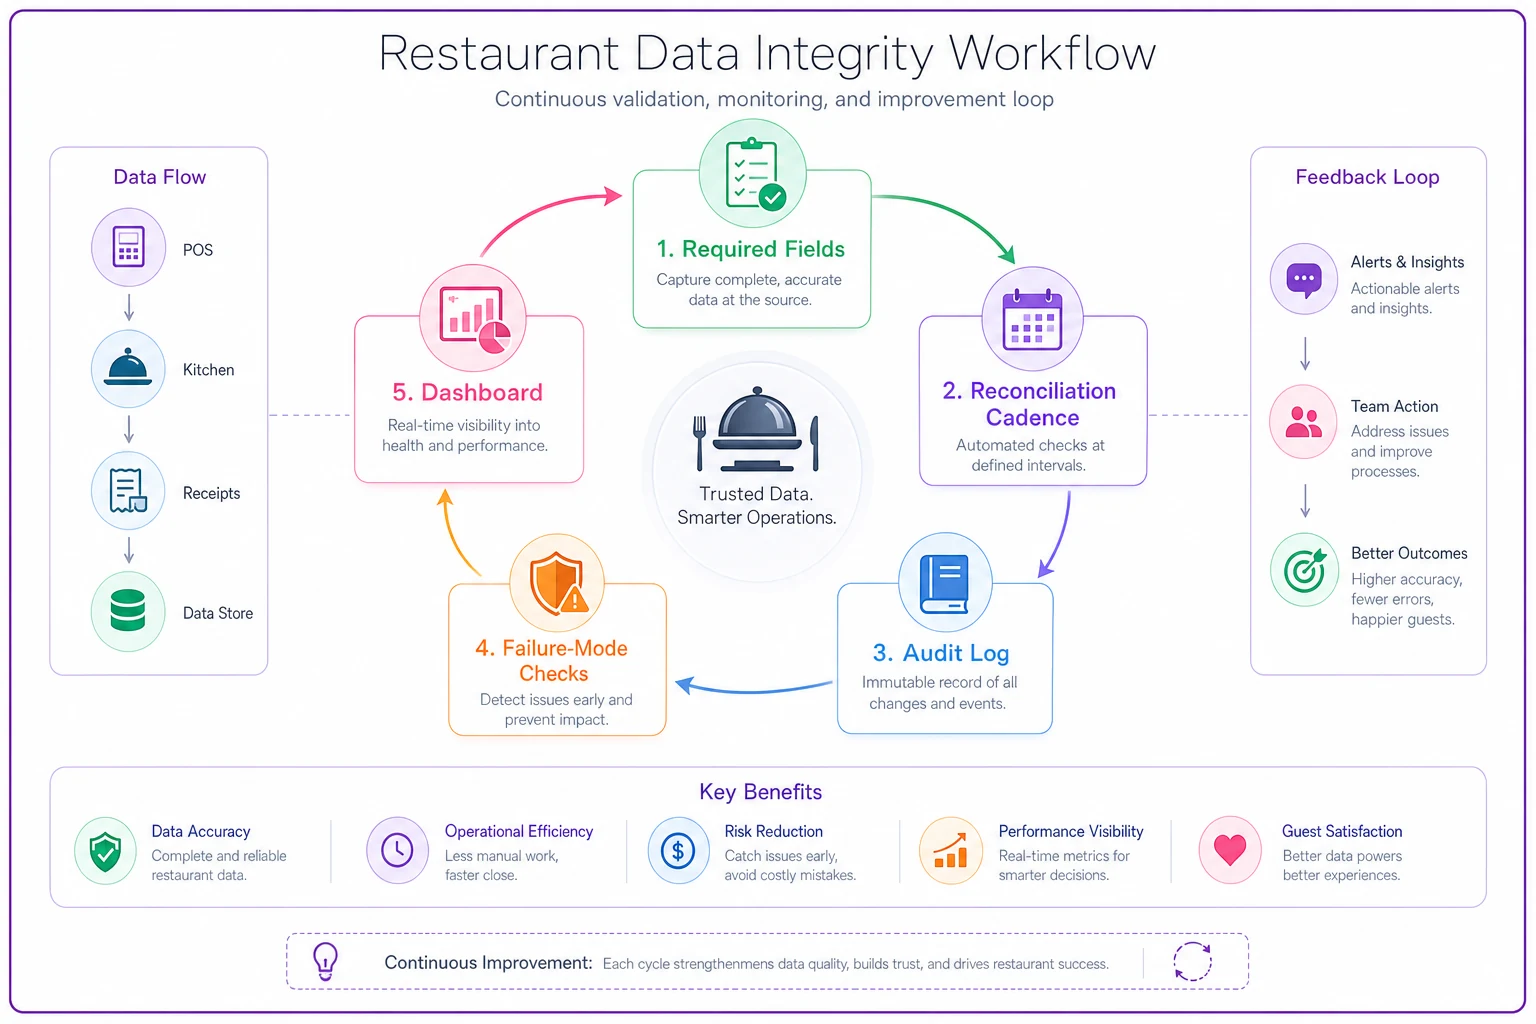
A simple diagram like this makes it clear how the pieces feed each other and why missing one weakens the rest.
Required fields set the definitions. Reconciliation checks whether reality still matches those definitions. The audit log explains the manual changes that reconciliation surfaces. Failure-mode checks catch the stuff that slips through all three before it reaches a decision. Pull any one out and the others get noticeably weaker — you can reconcile all you want, but without locked field definitions you're just comparing two numbers that were never supposed to match.
Whether you run this in spreadsheets, in your accounting workflow, or inside an operations platform that ties these systems together, the mechanism is what matters, not the tool. The restaurants whose forecasts people actually trust aren't the ones with the fanciest models. They're the ones where a manager can look at a number, know exactly what it means, know it was reconciled recently, and know that if something looked off, a check would have caught it. That trust is built in the plumbing, not the prediction — and it's the part almost everyone skips.
Ready to elevate your restaurant operations?
Join 2,000+ restaurants using Dineoly to enhance efficiency, increase table turnover, and delight diners.